Glyphs sit right on the notes for harmony and rhythm, pattern families trace a melody through a
piece, and a feature matrix lays out ten thousand pieces at once. Visual Musicology augments common music
notation instead of replacing it, from a single bar to a whole collection.
harmonic fingerprints · MusicViscomposer timeline · CorpusVispattern family · MelodyVis
01 The idea
Augment the score, don’t replace it
Visual Musicology works at the interface of musicology and visual analytics. Musicians and
musicologists read common music notation; the visualizations meet them there and add what the notation alone
hides: harmonic relations, rhythmic structure, recurring melodies, the shape of a whole repertoire.
“By augmenting instead of replacing common music notation, these designs improve the accessibility and
understandability of sheet music for people with varying musical and visual analytic expertise.”
From the abstract of Visual Sheet Music Analytics, PhD thesis, 2024
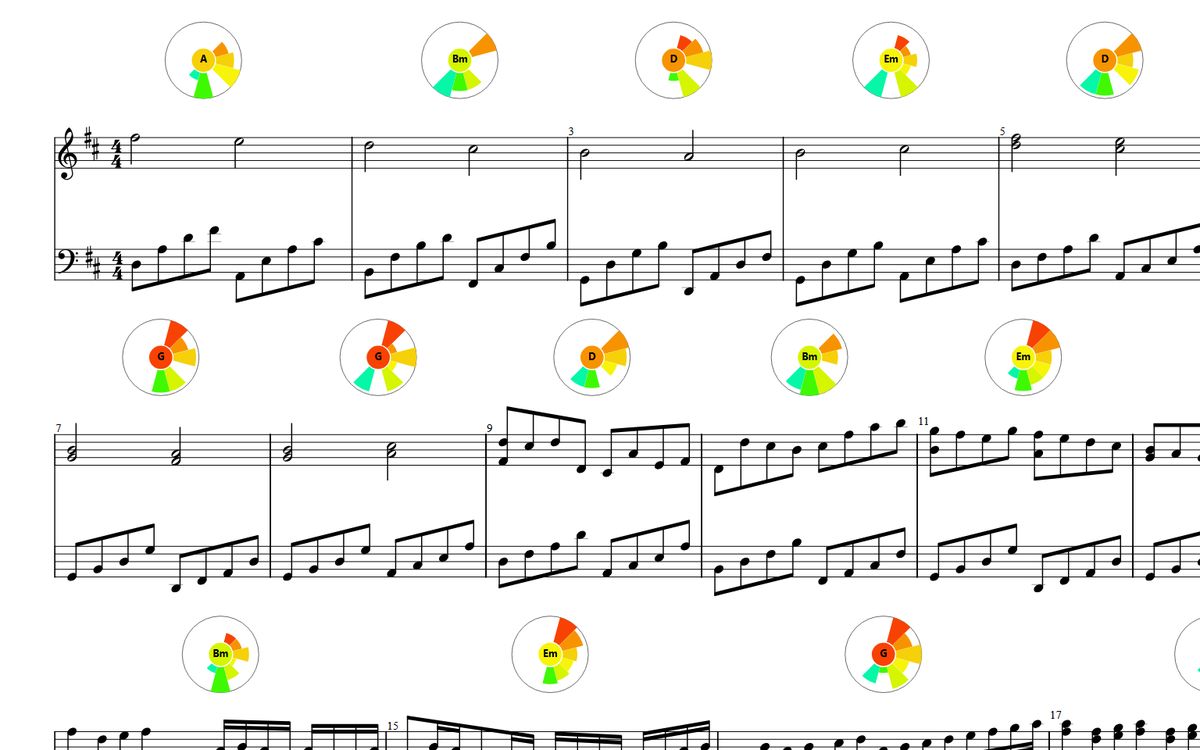
A constructed example of the principle: the bars stay as they are, the noteheads take the colour
of their pitch class, and each bar gets a harmonic fingerprint.
Keep the notation
Glyphs sit on top of the measures and leave the score itself unchanged, so readers can switch between the
familiar notation and the abstract view at any time.
Close and distant reading
From a single bar to the structure of a piece (bottom-up, MusicVis) and from a whole collection down to
one score (top-down, CorpusVis), with seamless transitions between the levels.
Methodology transfer
Established methods of visual data analysis are carried over to musicological questions, and designed and
evaluated together with domain experts.
02 The apps
Four tools, live in your browser
Every app runs on the IVIA infrastructure at ETH Zürich and opens with real sheet music. No
account, no installation: pick a piece and start reading.
1 Harmony & rhythm on the score
MusicVis
Glyphs on the notation, from one bar to the whole piece.
MusicVis augments digital sheet music with harmony and rhythm glyphs on top of every measure. Seamless
transitions lead from close reading of the notes to distant reading of the whole piece, and visual
queries search for harmony, rhythm and melody.
Harmonic fingerprints on the circle of fifths
Rhythmic fingerprints for every measure
Harmony, rhythm and melody search across the piece
The Glyph Explorer: how the glyphs respond to chords, scale degrees, meters and rhythms
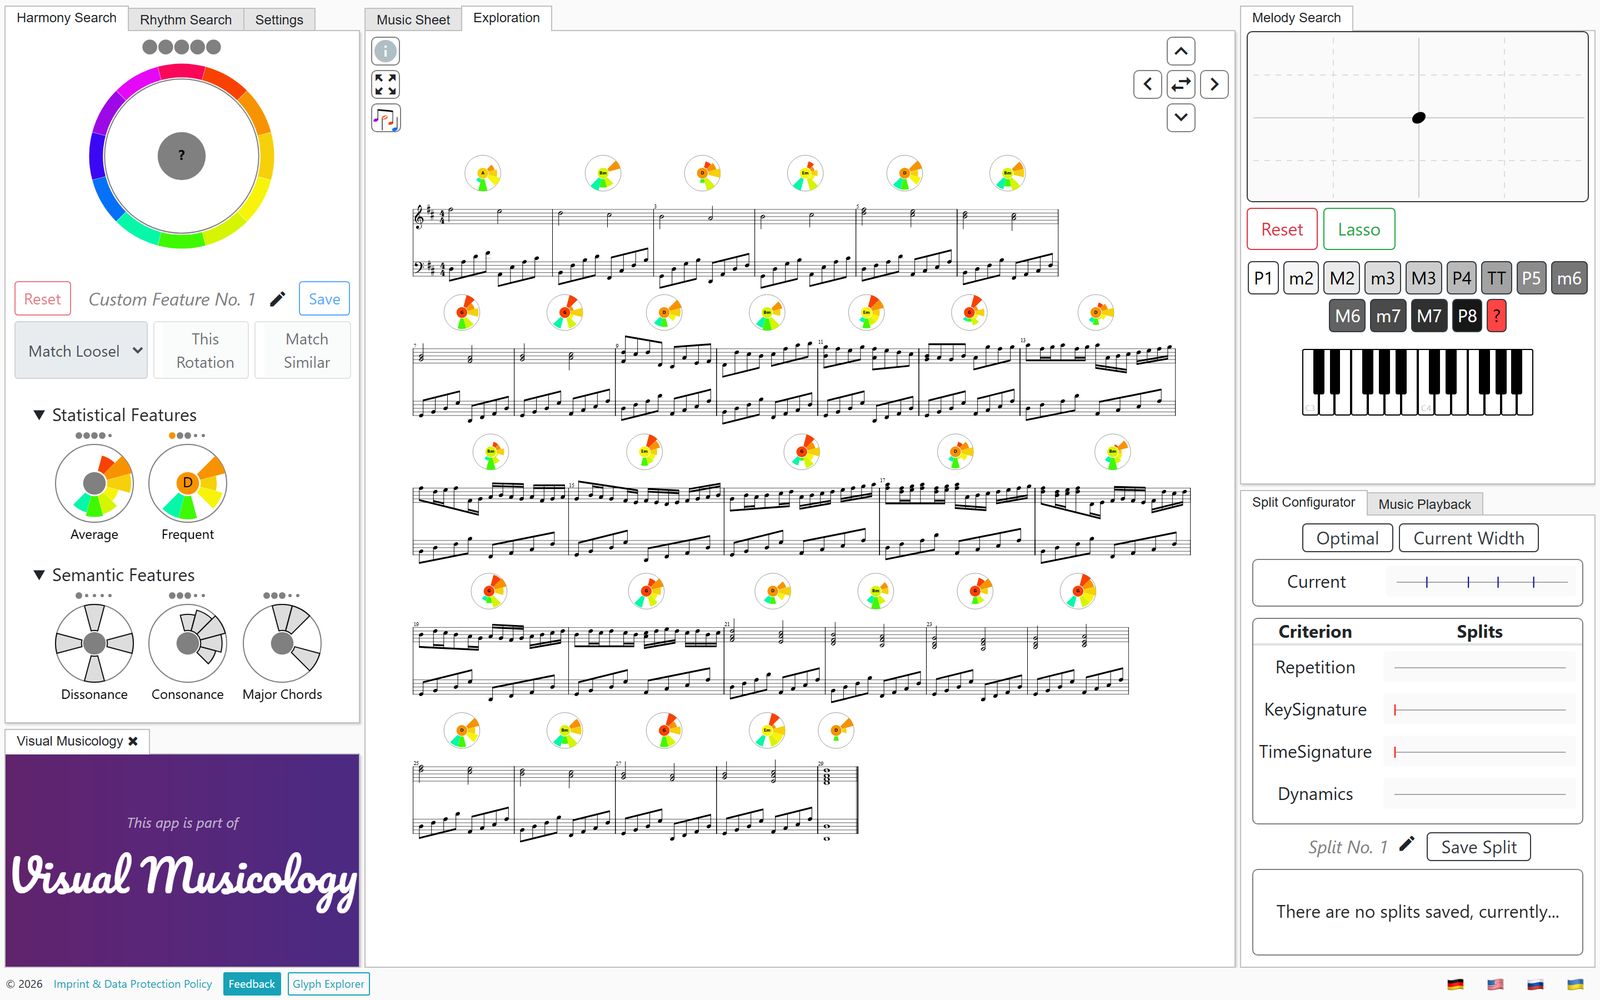
“Canon D” one level more abstract: a harmonic fingerprint per measure, labelled with its chord, next to harmony search, melody search and the split configurator.
2 Melodic patterns
MelodyVis
Find a motif, and every way it returns.
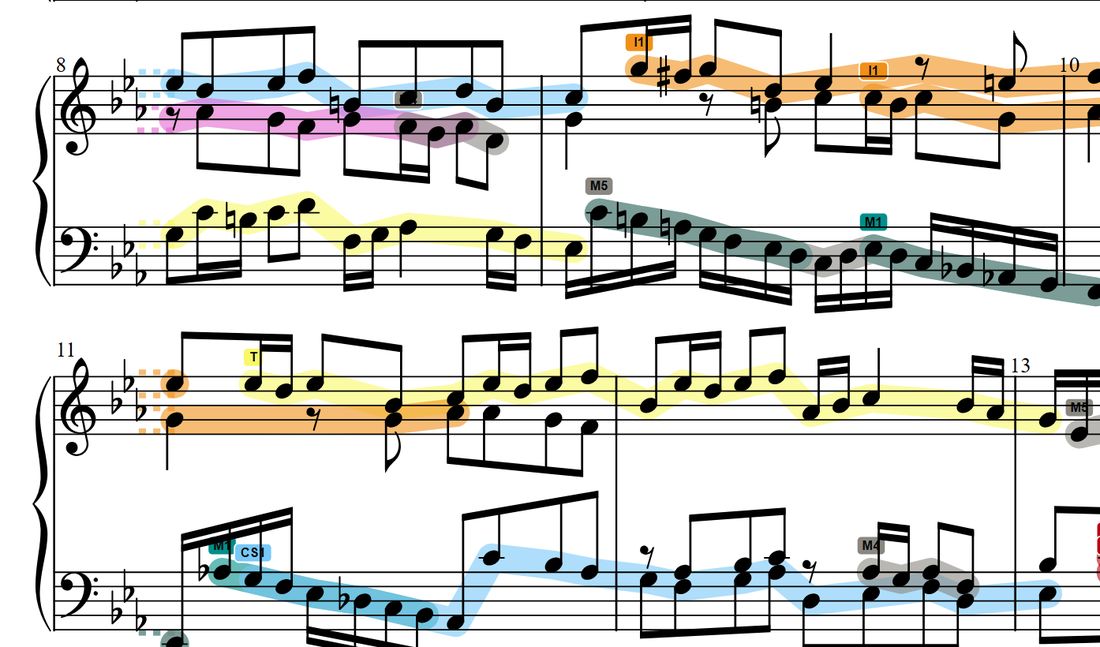
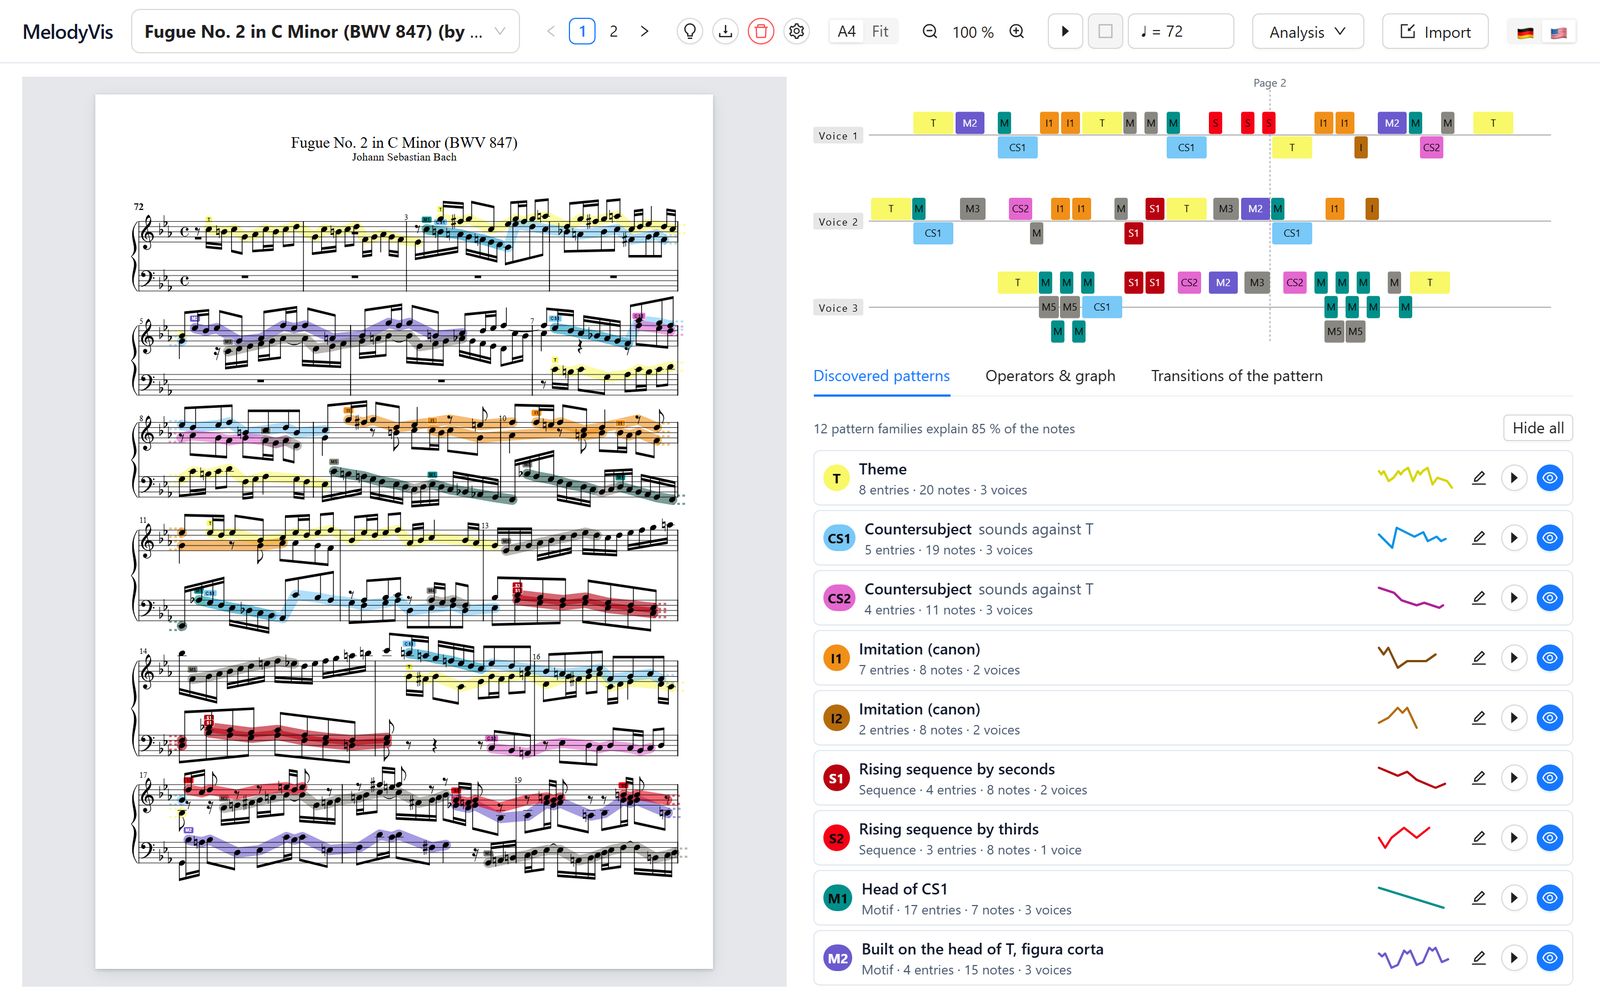
Select a melodic pattern in the sheet music and MelodyVis finds its repetitions and variations through
eight atomic operators and their combinations. It shows them in the score, per voice on a timeline and in a
transformation graph, and it discovers the pattern families of every piece automatically.
Transposition, inversion, retrograde, diminution, augmentation, reductions to pitch and to rhythm, deviation
Themes, countersubjects, imitations, sequences and motifs found for every piece
How a pattern moves through the voices, played back on a sampled grand piano
Import your own MusicXML files and save the analysis
Bach, Fugue No. 2 in C minor (BWV 847): 12 pattern families explain 85 % of the notes, shown in the score and per voice.
3 Sheet music collections
CorpusVis
Ten thousand pieces at a glance, and every single score one click away.
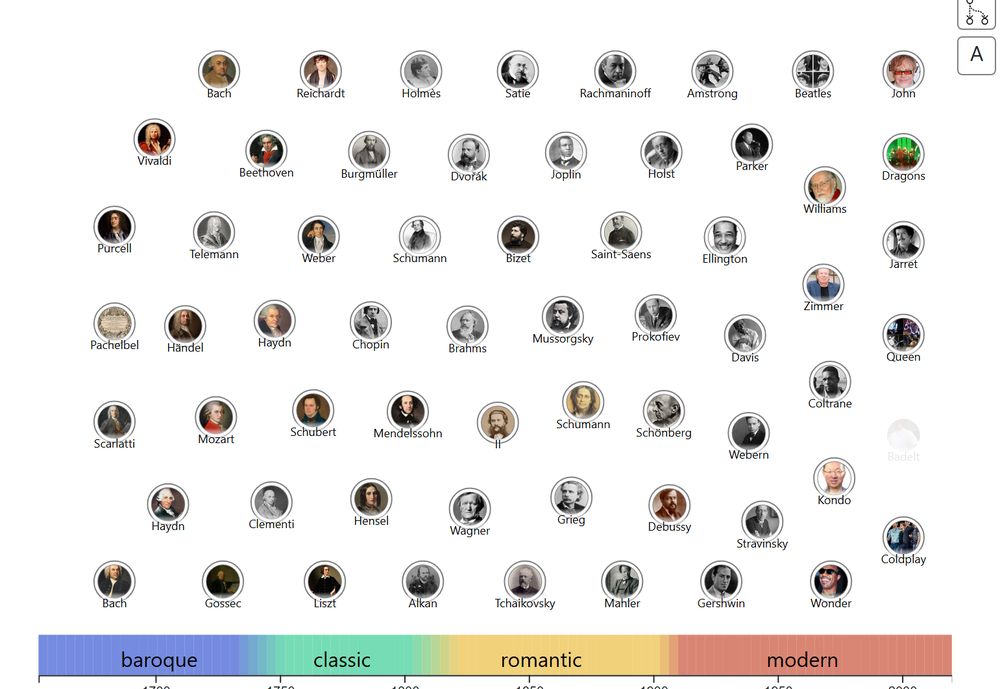
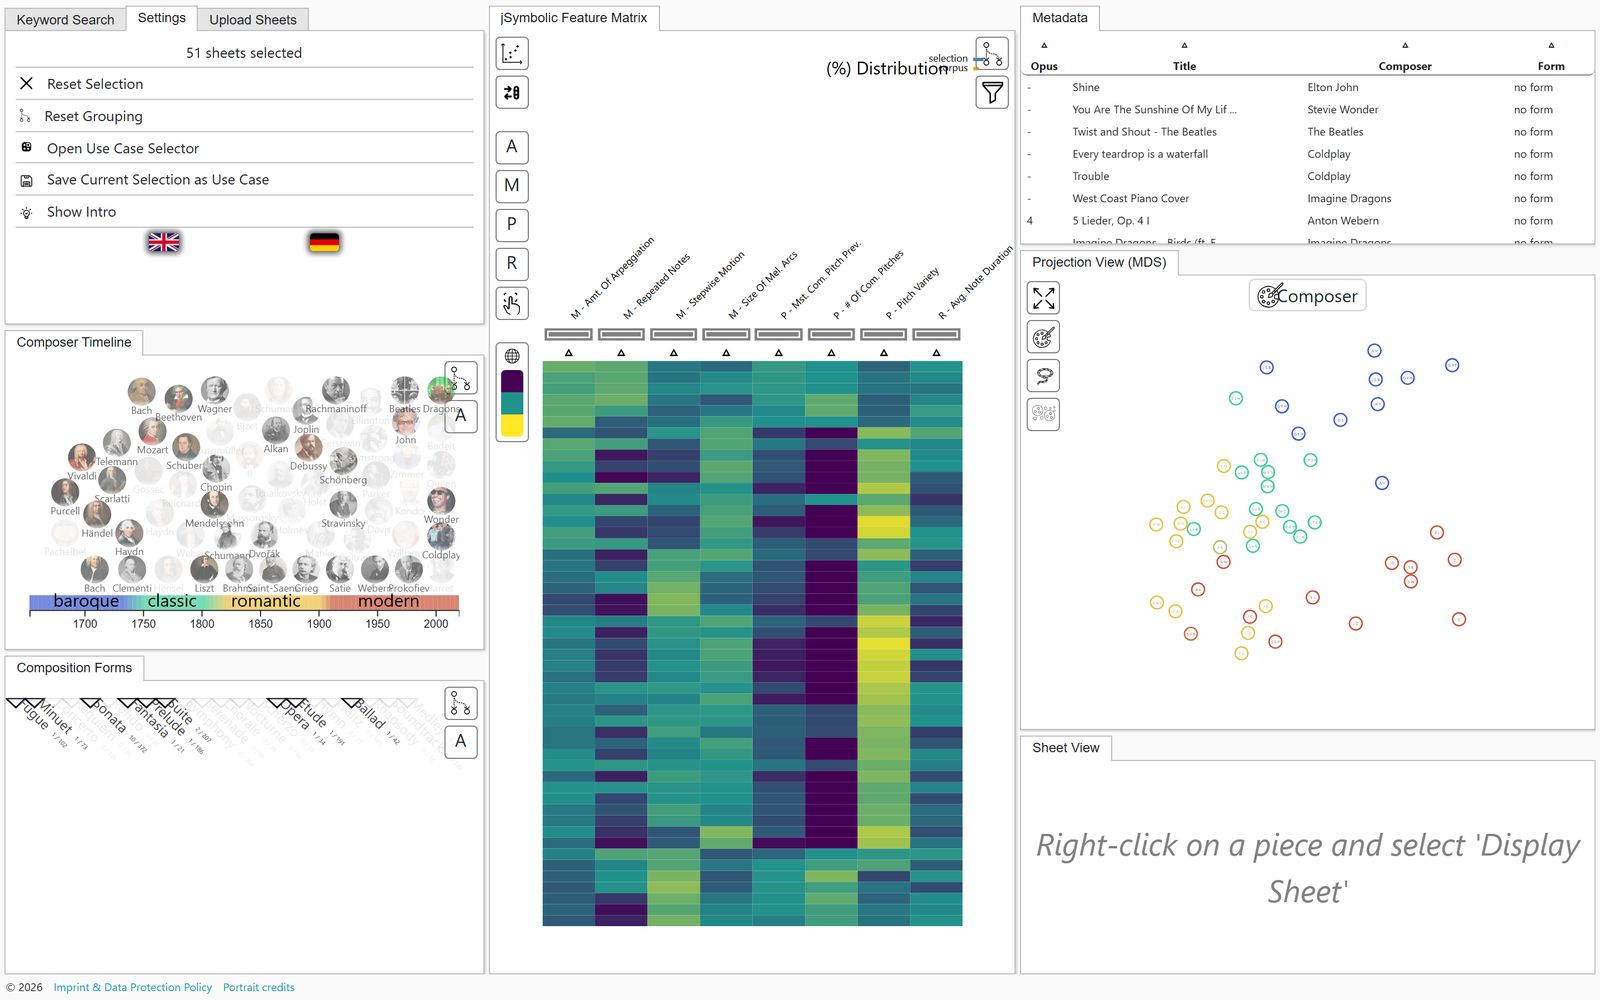
CorpusVis opens a collection of about 10,800 MuseScore pieces with their jSymbolic features. Analysts
compare composers, epochs and composition forms, find similar pieces, and drill down from the whole collection to single pieces.
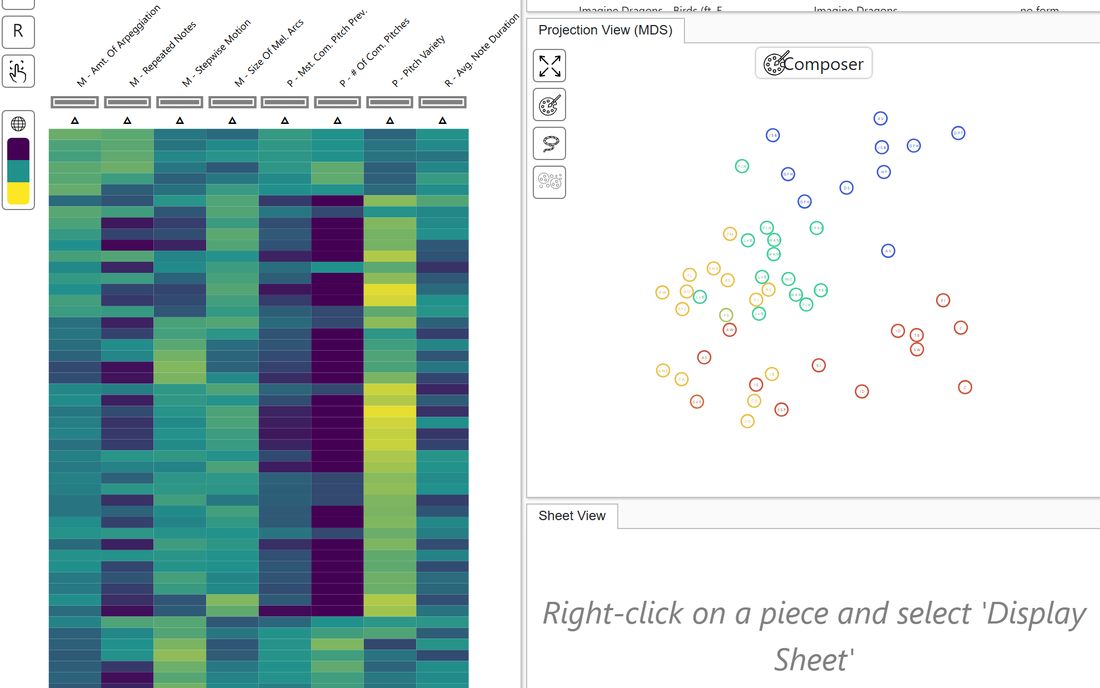
Feature matrix and MDS projection of the jSymbolic features
Composer timeline and composition forms
Saved use cases, such as tonality versus atonality
Use case “Epoch Comparison”: 51 pieces in the composer timeline, the jSymbolic feature matrix and the MDS projection, linked to each other.
4 Rhythm
RhythmVis
Rhythm, read like a clock.
RhythmVis places a rhythmic fingerprint on every measure: concentric rings for the durations from whole
notes to 32nd notes, filled clockwise where notes and rests begin. Recurring rhythms become recognisable
shapes, also for readers who are not fluent in the notation.
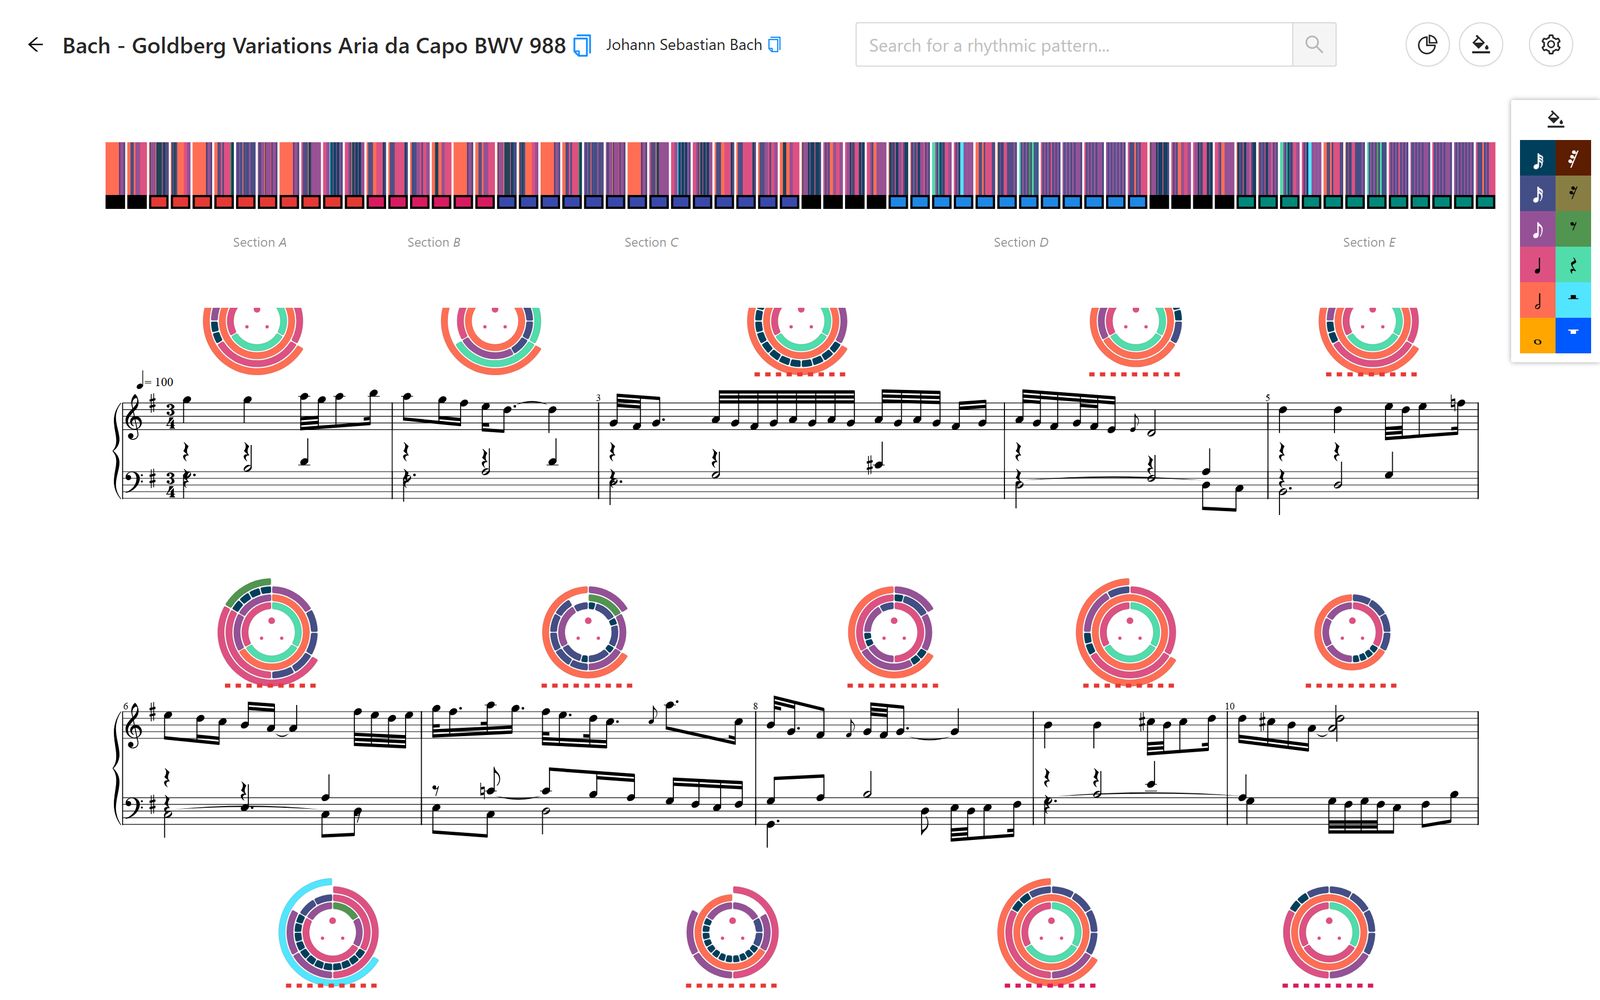
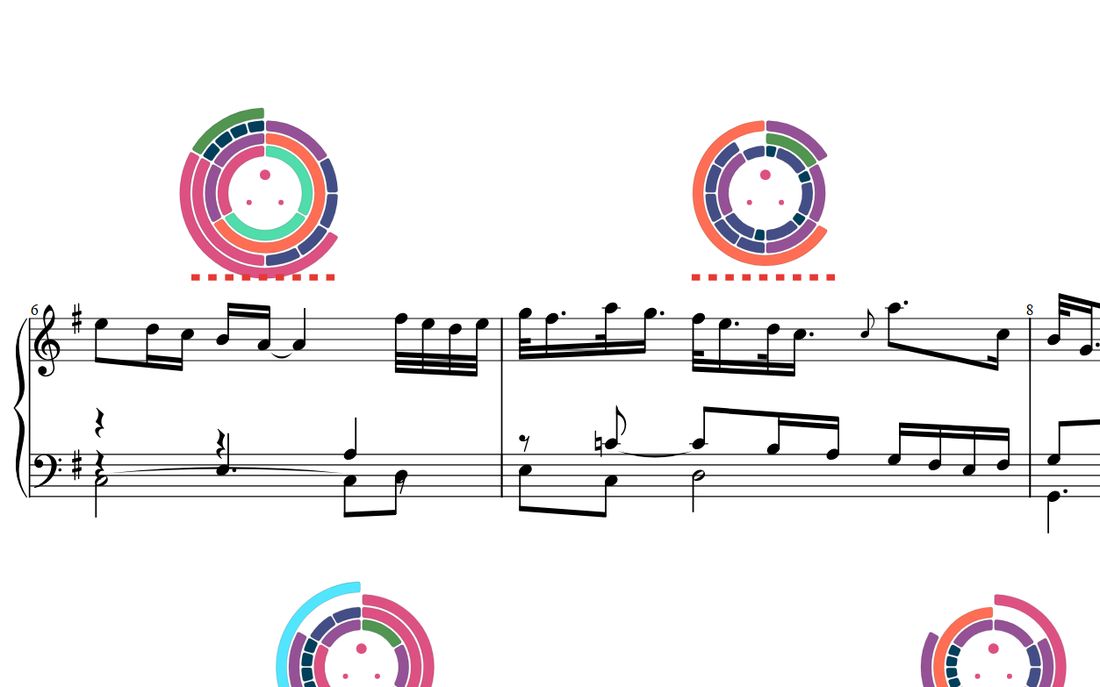
A rhythmic fingerprint above every measure of the score
The rhythm band: the whole piece at a glance, divided into its sections
Bach, Goldberg Variations, Aria (BWV 988): the rhythm band with its sections and a fingerprint on every measure.
03 The method
From notation to glyph
Each glyph condenses one musical dimension of a measure into a compact shape that keeps its
musical meaning: positions on the circle of fifths for harmony, a clock of note durations for rhythm.
Harmonic fingerprint
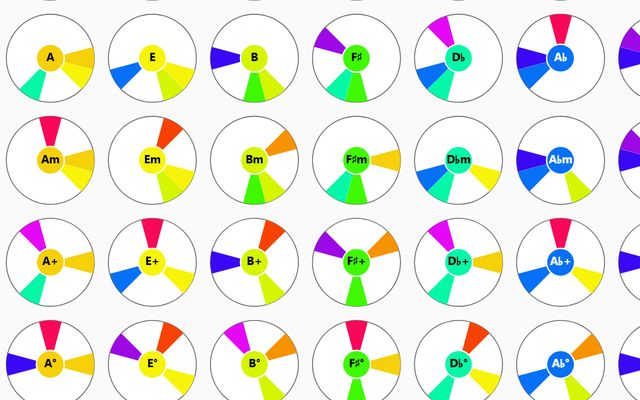
The twelve pitch classes are arranged along the circle of fifths, each with its own colour. For every
measure, a sector grows with how often its pitch class sounds; the root note sits in the centre. Related
harmonies give related shapes, whatever the octave.
Colour wheelFingerprint
The bar from the paper’s figure: E♭ five times, G and B♭ three times, F once. Root: E♭.
Durations form a tree: a whole note splits into two halves, four quarters, down to 32nd notes. The
fingerprint draws each level as a ring, read clockwise from the top like a clock, and fills an arc where a
note (warm) or a rest (cool) begins.
A constructed 4/4 bar with three voices: a whole note, two half rests, and a half, a quarter,
an eighth, a sixteenth and two 32nd notes. Where a note and a rest start together, the note is shown.
After Fürst, Miller, Keim, Bonnici, Schäfer and El-Assady, VIS4DH 2020.
Four levels of reading
The apps cover the whole range from close to distant reading. They share the same idea: start from the
score and keep the way back to it.
Measure
Glyphs
Harmony and rhythm of every bar, right above the notes.
Eight publications from 2018 to 2024 and the PhD thesis that brings them together.
PhD thesis · University of Konstanz · 2024
Visual Sheet Music Analytics
Matthias Miller. Doctoral thesis (Dr. rer. nat.), Department of Computer and Information Science,
University of Konstanz. Referees: Prof. Dr. Daniel A. Keim and Prof. Dr. Mennatallah El-Assady.
“Through integrating visual interactive data analysis with sheet music, this thesis addresses a new
interdisciplinary field: Visual Musicology. This work bridges the gap between information visualization
and musicology, paving the way for new methods to analyze and interpret music data, specifically focusing
on sheet music.”